

Executive summary
Peter Drucker gave us the term knowledge worker in 1959, and the emphasis was always on the first word. Knowledge workers did more than produce reports. They interpreted what systems recorded, reconciled conflicting evidence and supplied the meaning that made the output useful.
A controller handed a margin figure doesn’t stop at the figure. She examines the contracts behind it, removes a one-time concession and reaches a conclusion she can defend to the board: the underlying trend is flat, not falling. The report is the artifact. What she knows about the business is the product.
Much of that context was never recorded, because the person who held it was in the meeting. As parts of knowledge work are automated, the unresolved question is who, or what, will preserve the definitions, relationships, exceptions and evidence behind the numbers.
The number was in the system. The story was in the person.
This is why many internal AI deployments disappoint in a similar way. A capable model is connected to the company’s documents and systems, yet some answers remain fluent, plausible and wrong: the cited policy was superseded, two divisions use different definitions of active customer, or two figures should never have been combined. The model can retrieve what the company recorded. It cannot use context that was never made explicit.
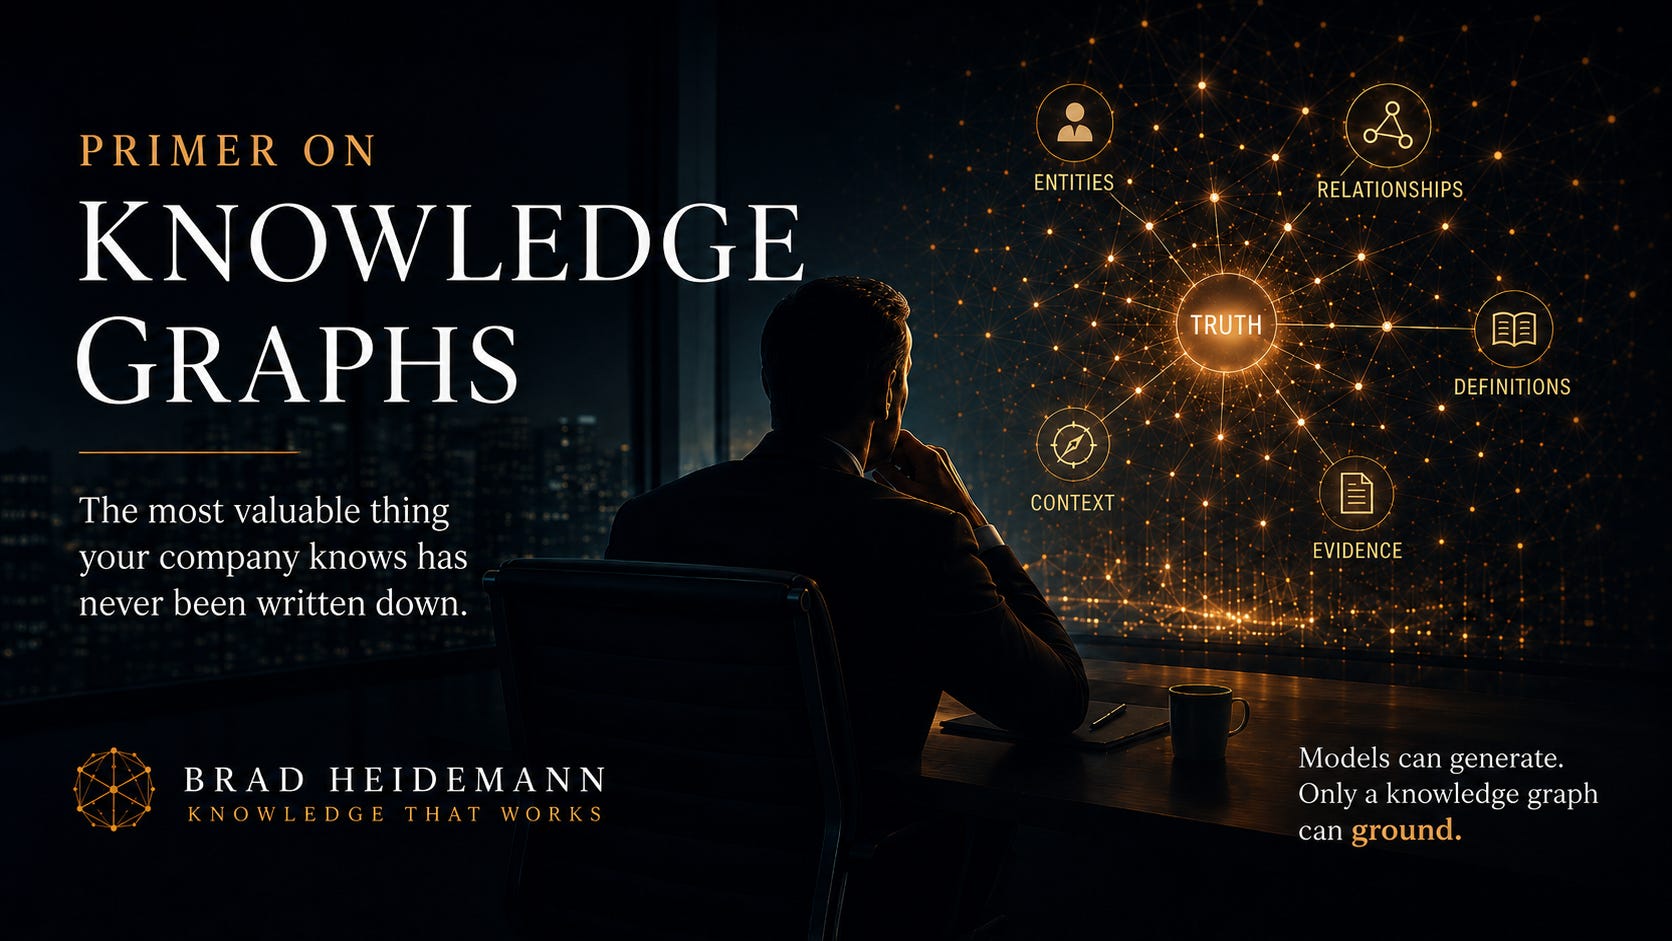
A knowledge graph is where that context gets made explicit, connected and reusable. It won’t hold everything a person knew, and no formal system should be expected to, but it holds the part that repeatedly drives decisions: the entities, the relationships, the definitions and the evidence. Google’s 2012 Knowledge Graph demonstrated the distinction at enormous scale. Traditional search matched strings, while the graph added entities and relationships that let search interpret many queries as questions about things. Google described the shift as things, not strings. The enterprise lesson follows directly. Finding documents about your business is not the same as modeling it well enough to answer questions about it.
The investment therefore has a different shape from a conventional technology project. Models can perform much of the mechanical work, including proposing taxonomies, extracting entities and drafting semantic models, but they cannot authoritatively decide what the business means. Whether a trial account counts as a customer, or which definition of margin applies in a given context, remains a business judgment. The enduring requirement is knowledge stewardship: people with the authority to make, document and maintain those decisions.
Automation may reduce staffing in some knowledge-work activities, and it creates a smaller and different need for stewardship. The work doesn’t vanish; it changes form and location. Most large enterprises have someone who owns the data. Few clearly own what it means.
One point belongs in a summary because it decides whether any of this pays. Enterprise AI programs rarely stall because the model lacks capability. They stall because nobody can show that the answers are right. What high-stakes functions require is narrower and harder than accuracy in the abstract: answers that are complete, current, and traceable to their evidence. A model grounded in a well-governed knowledge graph can return not only an answer, but the entities, relationships and sources used to construct it. That traceability is what separates a limited pilot from a system the organization is prepared to trust.
What follows provides an executive working knowledge of the subject: what a knowledge graph is, how its parts fit together, why identity and open standards matter, where ordinary retrieval falls short, and why governance remains a business responsibility. Enough to direct your teams, test vendor claims and understand what you are funding. For the argument this primer supports, see "Your Analytics Measure Motion, Not Meaning."Someone always knew why
Picture a quarterly business review from a few years back, before anyone in the room had said the words artificial intelligence out loud. The deck shows enterprise revenue down four percent. The number is correct, produced by a system, reconciled and signed off, and incomplete on its own.
What makes it useful is the woman who stands up and explains that the decline is two accounts, both of which moved to a new billing schedule, that one has already recovered in the current quarter, and that the trend underneath is flat rather than falling. She had pulled the contracts, called the account team, remembered a conversation from March, weighed two explanations and thrown one away. By the time she stood up, the number had stopped being a number and become an explanation the business could act on.
Systems count. People find out why. The finding out is where the value sits, and it has always been done by people across finance, operations, marketing and service whose real job, whatever their title said, was working out what the numbers meant and telling everyone else.
Michael Polanyi gave this a name in 1966. “We can know more than we can tell,” he wrote, describing the tacit dimension of expertise. Your organization runs on it: the veteran who knows which report to trust, the account manager who calls a customer before an invoice goes out, the correction made in a meeting that never reaches a document.
No knowledge graph can capture all tacit knowledge, and no formal system should be expected to. It can, however, preserve the entities, relationships, definitions, evidence and explicit judgments that repeatedly shape decisions. Systems of record were designed to capture outcomes, not the reasoning behind them, because the reasoning was usually standing in the room. That work was part of the job but rarely part of the job description, which is why it can disappear before anyone notices what was lost.
What happens when you point a model at everything
IT stands up an internal model with access to the whole enterprise: document stores, wikis, ticket history, the data warehouse and the intranet nobody has pruned since 2016. They add retrieval, put a chat window on it and open it to the business. The effort is serious and usually well engineered. Yet the answers are often not accurate or complete enough for consequential decisions.
The answers are not absurd, which is the difficulty. They’re fluent, they cite real documents, and they’re subtly wrong in ways only the person who used to do the job can catch. The system quotes a procedure that was superseded. It counts customers using a definition marketing abandoned two years ago. It adds two figures that were never meant to be added, because nothing in the data said they couldn’t be. Each answer is defensible on its face and wrong in a way that costs something.
The usual response is to reach for a better model, a longer context window or a different vendor. That response fails because the diagnosis is incomplete. The system may have everything the company recorded while still lacking what the analyst knew, what the account manager remembered or what the compliance officer would have caught. Context that was never represented cannot be retrieved reliably.
Artificial intelligence didn’t create this problem, and it won’t solve it on its own. What it does is distribute conclusions at scale without the context that originally made them meaningful. A knowledge graph is how an organization makes the reusable portion of that context explicit and machine-readable.
Four names, one customer
Start with a problem common in large enterprises. In the customer relationship management system the account is Acme. In the signed contract it is Acme Corporation. In finance it is ACME Holdings Inc. In the board deck it is our largest Midwest account. Four names may refer to one legal entity, several related entities or different concepts altogether, and a language model cannot resolve that reliably from text alone.
This is the distinction Google emphasized when it introduced its Knowledge Graph. A string is text. A thing has an identity. A knowledge graph addresses the enterprise version of the problem by assigning a persistent identity and recording relationships to other identified things. Acme is a Customer. Acme holds a Contract. That Contract covers a Service. That Service runs on a Platform. That Platform failed on Tuesday.
Nobody wrote a document saying Tuesday’s outage put our largest Midwest account at contractual risk, so ordinary document search can’t retrieve that sentence. But the relationship path exists, and a graph can traverse it. That is the core idea: a knowledge graph is a machine-readable model of the things a business cares about, the relationships between them, and the constraints and evidence that give those relationships meaning.
What a knowledge graph is made of
Writing down organizational meaning requires a language precise enough for a machine to use. A knowledge graph is built from four layers that stack: the words, the categories, the grammar and the statements.
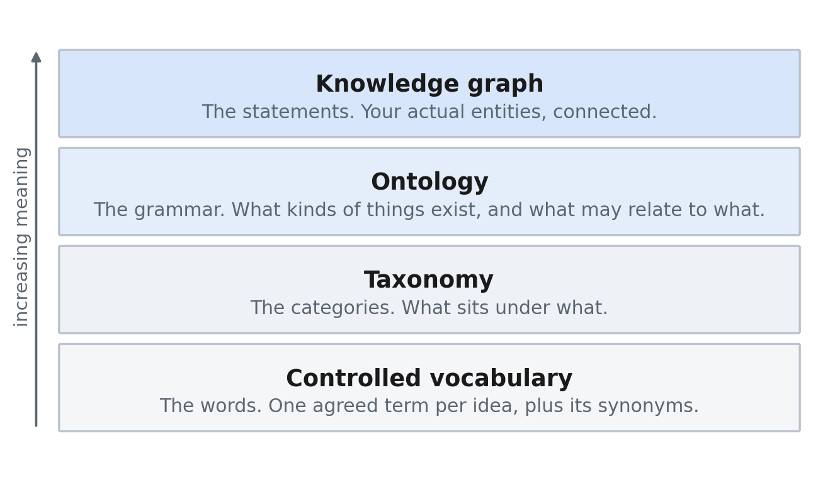
Figure 1. The four building blocks. Each layer adds meaning the layer below can’t express.
The words
A controlled vocabulary is an agreed list of terms, with one preferred label per idea and the synonyms people actually use. Legal writes counterparty. Sales says client. Support says account holder. Nobody has to change their language, because the vocabulary records that these are three names for one concept. A glossary tells humans what words mean. A controlled vocabulary tells machines that two documents using different words are discussing the same thing.
The categories
A taxonomy arranges those terms so that broader and narrower relationships are explicit. A Managed Services Agreement is a kind of Service Contract, which is a kind of Contract. A question about contracts now finds the managed services ones without anyone listing every subtype, which matters more than it sounds: most enterprise searches fail because the person asking didn’t know the right vocabulary to ask with.
The grammar
An ontology is a formal model of what kinds of things exist, how they may relate and which constraints apply. A Customer may hold a Contract. A Contract may not hold a Customer. The model may specify that every Contract has exactly one governing jurisdiction. A Subsidiary may inherit a master agreement’s terms unless explicitly overridden. The ontology doesn’t contain every business fact; it defines the structure within which facts can be represented and checked.
An ontology does not enforce policy by itself. It makes relevant concepts and constraints explicit and machine-readable. When those constraints are connected to validation logic, permissions or operational controls, a system can test a proposed action before completing it and reject actions that violate the encoded rules.
This is also where these programs become genuinely difficult, and the hardest part is often not technical. To define Customer as one legal entity under one master agreement, someone must decide how to treat divisions that have historically counted regional subsidiaries separately. To formalize revenue recognition, someone must resolve conflicting practices. Each decision affects reporting, incentives and authority, so ambiguity usually has a constituency.
This is why the work fails when it is delegated too far down the organization. It crosses divisions, and a director may not have the authority to settle a definition disputed by peers. Drafting the semantic model is increasingly tractable. Adjudicating contested business meaning is not, and it requires an accountable owner with authority across the affected domains.
An ontology formalizes business meaning. Deciding that meaning is not an IT decision.
The statements
The populated statements about your actual customers, contracts, products, policies and people, connected according to the model. The first three layers define the language and structure. This layer fills that structure with identified entities, relationships and supporting evidence. In practice the layers evolve together: populating the graph exposes gaps in the vocabulary and errors in the ontology.
Put the four together and the roles become clear. The vocabulary defines preferred labels and synonyms. The taxonomy organizes broader and narrower categories. The ontology defines permissible relationships and constraints. The knowledge graph records statements about the actual business using that shared structure. Everything that follows concerns what this makes possible and what is required to keep it trustworthy.
Whose number is right?
A semantic layer is a governed model of meaning that sits between data and the applications that use it. Sometimes it establishes one enterprise definition. Sometimes it records several legitimate definitions and the contexts in which each applies. The goal is not artificial uniformity; it is explicit, reusable meaning. A knowledge graph can provide the structure for that layer.
Most enterprises have fragments of such a layer rather than one coherent model. The reporting tool has one definition of active customer. Marketing has another. Forecasting has a third, buried in a query written by someone who has left. The definitions may each be valid for their purpose, but the differences are rarely explicit, which is why leadership teams spend meetings arguing about whose number is right instead of deciding what to do.
That disagreement used to be resolved by a person, one meeting at a time, through experience and institutional memory. A semantic layer makes the definitions, contexts and sources explicit, so systems and models can apply them consistently, or explain why different definitions produce different answers.
Why standards turn this into an asset
A company can build a knowledge graph with proprietary technology, open standards published by the World Wide Web Consortium, or a combination of both. The choice has technical and economic consequences. Executives don’t need to memorize the acronyms, but they should understand what each standard contributes.
IRI A permanent web address for every concept and every thing. Not a label, an identifier.
RDF The format for stating a single fact: subject, verb, object. The smallest possible unit of meaning.
SKOS The standard for vocabularies and taxonomies. Preferred terms, synonyms, broader and narrower, across languages.
OWL The standard for rules and inference. States what must be true, and lets machines derive facts nobody typed.
SPARQL The query language. One way to ask questions across everything the graph knows.
Why one identifier changes the economics
Persistent identity carries most of the commercial weight. Giving every concept and entity a durable identifier sounds like a technical detail. It is the mechanism that allows information from different systems to accumulate around the same thing.
Shared identity reduces repeated reconciliation. Once an entity has a persistent identity, finance’s view of Acme, support’s view, the contract, the shipping history and last week’s escalation can attach to the same entity without requiring every pair of systems to be reconciled independently. A more complete customer view becomes a property of the shared model rather than another isolated integration project.
New sources connect rather than fully merge. After an acquisition, the acquired customer list can be linked to existing entities by asserting where identities match, while the source systems remain intact. This reduces repeated reconciliation; it does not eliminate source integration or data-quality work.
Answers become more auditable. When the graph preserves provenance, a system can show which facts it used, which entity each fact concerns and where the fact originated. That is more defensible than pointing to a paragraph that happened to contain a similar name.
Institutional memory survives reorganization. Departments are renamed, systems replaced and vendors changed, while stable identifiers preserve continuity. What the company recorded about a customer in 2019 can remain attached to the same entity in 2029, provided identity and provenance are maintained.
Taken together, these mechanisms change the integration cost curve. In a conventional point-to-point architecture, each new source requires new reconciliation against systems already connected. Shared identifiers and reusable semantics reduce that repeated work, because a source can connect once to the common model and become available to multiple consumers. The cost doesn’t disappear, and poor source data still has to be addressed, but integration becomes more cumulative and less repetitive. Over a decade of acquisitions and platform changes, that difference compounds.
The remaining standards support that accumulation. Common fact formats make datasets easier to combine. Controlled vocabularies connect synonyms such as churn and attrition. Ontologies support constraint checking and inference when the necessary relationships are represented. Open specifications also improve portability across tools, although they do not guarantee vendor independence. A model of the business may be a twenty year asset. The platform hosting it may not be a twenty year company.
Two graph models, and why the choice isn’t the decision
Your technical teams will raise a distinction between two kinds of graph. Property graph and Resource Description Framework (RDF) models emphasize different concerns. Property graphs are commonly optimized for efficient traversal and operational workloads. RDF graphs emphasize global identifiers, standards-based integration, semantic interoperability and inference. The distinction is real, and modern products increasingly blur it.
Many mature enterprises use both patterns. The executive question is not which graph model is universally superior, but which business questions, interoperability requirements and governance needs the architecture must support. The practical risk is not choosing wrong. It is spending a year choosing. A team still debating graph models has not started building, and the business questions will settle the matter faster than the debate will.
Why enterprise AI often stalls at the compliance door
Enterprise AI programs rarely stall because the model lacks capability. They stall because nobody can show that the answers are right. What high-stakes functions require is narrower and harder than accuracy in the abstract: answers that are complete, current, and traceable to their evidence.
A common deployment pattern is retrieval-augmented generation, or RAG. Rather than relying only on what the model learned during training, the system retrieves relevant text from enterprise sources and asks the model to answer from that material. It is a sound and useful technique. Its quality depends heavily on what is retrieved, how complete and authoritative the sources are, and how permissions and versions are handled. Ordinary similarity retrieval has four structural limitations that tuning alone does not remove.
Similarity is not the same as authority. A superseded 2019 travel policy may resemble a question about the current travel policy as strongly as the current document does, unless version, status and authority are represented and enforced.
Similarity retrieval alone does not guarantee complete aggregation. How many active contracts have automatic-renewal clauses expiring in the third quarter requires an exhaustive set, a governed definition of active, and a counting operation. Retrieving a few similar contracts and asking the model to generalize is not the same task.
A text retriever does not automatically follow multi-step relationships. Which customers are exposed to Tuesday’s outage may require a chain from outage to platform, platform to services, services to contracts and contracts to customers. Each relationship has to be represented, or discovered with additional tools.
Identity is not inherent in text retrieval. Documents that say Acme and documents that say ACME Holdings may be treated as unrelated unless entity resolution establishes that they refer to the same legal entity, or records that they do not.
These limitations create a broader problem: the system may not know that its evidence is incomplete. It presents the best material it found with the same fluency whether retrieval was comprehensive or partial. Fluency is a weak signal of evidentiary quality.
The arithmetic that kills pilots
Put an economic frame around that. A system that is often right but cannot identify its exceptions still requires a qualified person to verify every consequential answer. Verification erases the expected savings, because the work has moved from producing the answer to checking it, and checking usually takes the same expertise the program was intended to free.
The constraint becomes sharper in high-stakes functions. Where answers cannot be traced to their evidence, compliance is unlikely to approve, legal is unlikely to rely on the output, and human resources and regulated business units tend to restrict use altogether. The exclusions land on the highest-value work, which leaves a pilot confined to lower-stakes tasks and returns that do not support the original business case.
The model may be capable. The deployment is still missing the evidence architecture required to use it safely.
What changes when the graph is underneath
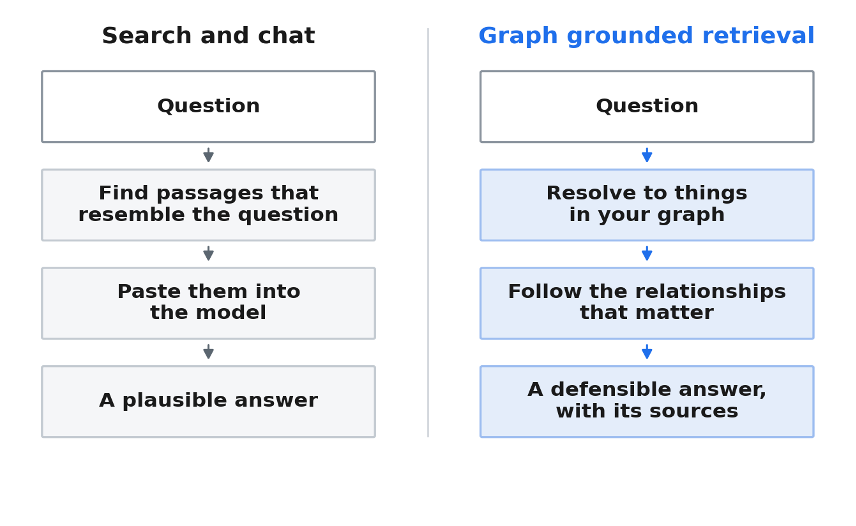
Figure 2. The same question, two paths. The difference isn’t the model. It’s what the model is handed.
With graph-grounded retrieval, often grouped under the label GraphRAG although implementations vary, the sequence changes. A question can be resolved to identified entities rather than only to words. The system can then traverse relevant relationships, apply recency, type and permission constraints, and retrieve a smaller set of structured facts with provenance. The model’s task narrows from finding and interpreting an open-ended corpus to explaining evidence selected by an explicit model, which reduces the opportunities for unsupported inference.
Andreas Blumauer, who founded the Semantic Web Company in 2004 and built PoolParty into one of the longest running enterprise knowledge graph platforms, illustrates the distinction with a medical example. Search a document store for insomnia and you get documents that mention insomnia. In a knowledge graph where the relevant relationships have been represented, the system can traverse from insomnia to possible causes, treatments, related conditions and interactions. One approach finds text about a topic. The other follows explicit relationships among identified concepts.
A search-and-chat system can produce a plausible answer. A graph-grounded system can produce an answer with an evidence path and chain of custody.
The two approaches belong together rather than in competition, and treating them as alternatives is an expensive mistake. The model supplies language understanding and explanation. The graph supplies identity, governed relationships, permissions and provenance. Without the model, the graph is difficult for most users to query. Without a semantic and evidentiary layer, consequential answers remain difficult to audit. Auditability is the price of admission to the enterprise use cases worth funding.
Two standard objections
“The models are good enough”
The case for knowledge graphs as it was often made in 2018 assumed models that could read little, reason only over short contexts and use few tools. Those assumptions are much less true today, and part of the objection lands. Retrieval is inexpensive and useful for a large class of questions, and organizations no longer have to structure everything before deriving value from anything. At the same time, models can now propose taxonomies, extract entities and draft ontologies for expert review, sharply reducing the effort required to produce a first version.
What has not changed is the need for authoritative business context. A model may infer that ACME Holdings and Acme Corporation are related, but it cannot authoritatively decide that they are the same legal entity under a particular agreement. Access rules attach to entities and concepts rather than to paragraphs. The origin of a number has to be traceable. Whether a trial user counts as a customer remains a governed business decision. Capable models didn’t remove the need for organizational context. They made its absence easier to see.
“This is knowledge management, and knowledge management failed”
Executives who lived through the 1990s often raise this objection before technologists do, and the history matters. Nonaka and Takeuchi published The Knowledge-Creating Company in 1995, a decade of enterprise knowledge-management programs followed, and many ended in abandoned portals, unmaintained taxonomies and a lasting allergy to the phrase.
The difference now is structural rather than a matter of better intentions. Earlier programs faced three persistent constraints: capture was largely manual and competed with people’s real jobs; the consumer was a person who had to remember the portal existed and search it; and taxonomies were maintained by hand and decayed as the business changed. Each constraint can now be reduced. Models extract candidate entities and relationships from existing material. Machines consult the model as part of a workflow rather than waiting for a person to search a portal. Maintenance can be assisted by machine-generated proposals that people review and approve.
What has not moved is governance. Someone still has to decide what the words mean. That was the part knowledge management got wrong by treating it as a librarian’s task rather than an executive’s, and it is the part this paper insists on hardest.
The end of the fifth version
Enterprise content is often written once, filed inconsistently, found rarely and reused less than it should be. Many large organizations have the same product explanation written five or six times by teams that did not know the other versions existed. A semantic layer changes the operating model at three points.
Creation. Before writing, an author can see what already exists on the concept, in every language and every format. The fifth version doesn’t get written. What gets written is the piece that’s actually missing, and the gaps become visible instead of assumed.
Curation. Tagging against a controlled vocabulary can be done automatically and consistently across the whole corpus, including the archive nobody was ever going to touch by hand. Consistency at that volume is a machine job. People should be deciding what the categories are, not applying them ten thousand times.
Dissemination. Content can shift from fixed pages toward reusable components assembled for a particular context. This is the argument I have been making about personalization for a decade: the relevant variables are the customer, the content and the context. Many organizations identify the customer but underuse the signals that explain what the person responds to and why the person is here now.
Then there is the reinforcing loop. What people ask reveals what the graph is missing, turning failed queries and abandoned sessions into a curation work list. Models become better at using the graph, and the graph improves through governed feedback from actual use. The asset becomes more useful over time, provided the feedback is reviewed rather than accepted automatically.
Agents act, so they need the rules in writing
Everything above matters more once systems stop answering questions and start taking actions. An agent differs from a chatbot in the one respect that changes the risk profile entirely: it does things. It files, orders, schedules, escalates, updates and commits. A wrong answer is embarrassing. A wrong action is expensive and sometimes cannot be undone.
Acting safely requires at least three capabilities, and a knowledge graph supports each. The first is a shared map: what exists, what it’s called, how it relates. The second is constraints, represented so that authorization, validation or workflow controls can check them before an action completes. The third is an audit record at the level of entities, facts and actions rather than chat transcripts, which requires provenance and decision logging designed in from the start.
Underneath all three sits a constraint that predates artificial intelligence: you cannot safely automate a process whose entities, decisions and boundaries cannot be described. An ontology formalizes part of that description where a machine can use it. Deploying agents against unmodeled data means allowing automation to rely on assumptions that were never made explicit. That works in a demonstration and fails in operation.
Automation cuts headcount, curation adds some back
Which brings us back to the question this paper opened with. Once the people who knew are gone, who knows? The answer is nobody, unless the organization makes it somebody’s job.
Models now handle a substantial share of the mechanical labor: proposing taxonomies, extracting candidate entities, drafting ontologies, tagging archives no team would process by hand. What once took months can produce a first draft in weeks. That shift is one reason the economics are more favorable than they were in 2018.
What models cannot do is decide. Whether a trial account is a customer. Whether a distributor is a channel, a customer, or both depending on the contract. Which of two divisions’ definitions of margin survives contact with the other. These are judgments about what the business means, made by people with the standing to make them stick, and then maintained as the business changes, because the business always changes.
Organizations that automate knowledge work therefore take on a requirement many have not formally staffed: knowledge stewardship. At enterprise scale it is not a project with an end date but an ongoing capability responsible for keeping the company machine-readable, with an owner, a budget, a governance forum and enough authority to resolve definitions across divisional lines. It sits between the data organization, which owns the infrastructure, and the business, which owns the meaning.
Most large companies have someone who owns the data. Few clearly own what it means.
The direction here is clear and the scale isn’t. Nobody can yet tell you how large this function needs to be relative to the roles being automated, and anyone quoting a ratio is guessing. What isn’t in doubt is that the work exists, that it doesn’t disappear when the knowledge workers do, and that on most organization charts it currently has no home. For anyone building a business case, that means some of the savings from automating knowledge work has to be spent writing down what those knowledge workers knew. Skip that step and you haven’t automated the function. You’ve deleted it.
What a knowledge graph won’t do
• It isn’t a database replacement. A knowledge graph doesn’t store everything. It stores meaning and identity and points at the systems holding the rest. Anyone proposing to migrate your transactional data into a graph should be asked why.
• It will not survive without an owner. Vocabulary and definition decisions affect incentives, reporting and authority. Someone must be accountable for resolving disputes and maintaining the result as the business changes. Governance failures are at least as consequential as technology failures.
• Enterprise-wide first attempts carry high failure risk. Attempts to model the whole business before demonstrating value have a long history of expense and delay. A narrower scope reduces uncertainty and exposes governance problems before they become enterprise-wide commitments.
• It doesn’t improve the underlying quality of your information. It makes the state of it legible, which many organizations experience as a problem rather than a benefit, at least in the first month.
The underlying technologies are mature. Graph databases, World Wide Web Consortium standards and automated enrichment are used in production across life sciences, financial services, publishing and other sectors. What remains unsettled is which graph-grounded retrieval patterns will prove most durable as models and tools improve. The architecture is moving quickly. The underlying requirement is more stable: a machine can reason consistently only about the aspects of a business that are represented, governed or retrievable through reliable tools.
The advantage that compounds
Peter Senge described the learning organization in 1990 as an enterprise that gets smarter through experience, where insight compounds instead of evaporating. Executives wanted to build that company and mostly struggled, not because the ambition was wrong but because the instruments were limited. We could account for money moving through the enterprise to the penny, while organizational understanding remained informal and difficult to preserve. We built organizations that count brilliantly and learn inconsistently.
The instruments are improving. As leading model capabilities become broadly available at comparable prices, much of the advantage in the model layer will be temporary and rented. The durable difference comes from organizational context: systems that understand the entities, relationships, definitions and evidence specific to the business. Organizations that represent and govern that context can reuse it across every model and application that follows. Organizations that don’t will keep buying more powerful engines and pointing them into the same fog.
None of this is glamorous. It is the work of deciding what the organization’s words mean, making relationships explicit and recording the evidence behind important claims. That is less fashionable than selecting a model, and more consequential to whether the resulting system can be trusted. A reasonable place to begin is smaller than most people expect: take one question your executives ask repeatedly that currently takes three people a week to answer, and model only the things that question touches.
The work of knowing what your numbers mean didn’t stop being necessary. It stopped being anybody’s job. Writing down the part that can be made explicit is how you get it back, and this time it doesn’t leave when the person does.
Sources and further reading
Related work by the author
Every Number Has a Story to Tell. First in the Every Number Has a Story series. bradheidemann.com.
Counting Isn’t Reading. Second in the Every Number Has a Story series, on why analytics capture motion and not meaning. bradheidemann.com.
Most AI Strategies Are Just Efficiency Theater. On automating the old model rather than changing it. bradheidemann.com.
AI Didn’t Create the Marketing Crisis. bradheidemann.com.
Semantic Segmentation to Improve Personalization. Earlier treatment of the customer, content and context argument. tahzoo.com.
Referenced in this paper
Peter Drucker, Landmarks of Tomorrow. Harper, 1959. Origin of the term knowledge worker.
Michael Polanyi, The Tacit Dimension. Routledge, 1966. Source of the observation that we can know more than we can tell.
Peter Senge, The Fifth Discipline: The Art and Practice of the Learning Organization. Doubleday, 1990.
Ikujiro Nonaka and Hirotaka Takeuchi, The Knowledge-Creating Company. Oxford University Press, 1995.
Andreas Blumauer, Semantic AI: Bringing Machine Learning, NLP and Knowledge Graphs Together. KMWorld, 2018.
Andreas Blumauer and Helmut Nagy, The Knowledge Graph Cookbook: Recipes That Work. Edition mono, Vienna, 2020.
Amit Singhal, Introducing the Knowledge Graph: things, not strings. Google, 2012.
W3C standards referenced: RDF, SKOS, OWL and SPARQL. Specifications are public at w3.org.